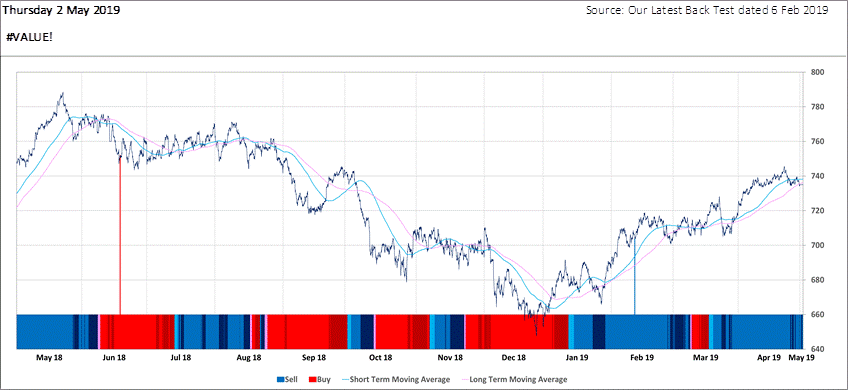
Algorithmic "Buying" and "Selling" is largely determined by the market's "Mood".
The principal components of "Mood" are benchmark "Volatility" and "Phase". We measure the latter in real time by comparing a short term moving average (or "STMA") with a long term moving average (or "LTMA").
- BullWhen the STMA is above the LTMA, shown in shades of blue.
- New BullA period after the crossover from "Bear" to "Bull".
- Free BullFrom a "New Bull" until the STMA peaks: Often a good time to "Sell"
- Old BullFrom the peak of the STMA usually until the next crossover from "Bull" to "Bear".
- SellOur individual "sell" prompts are shown by vertical blue lines.
- BearWhen the STMA is below the LTMA, shown in shades of red.
- New BearA period after the crossover from "Bull" to "Bear".
- Free BearFrom a "New Bear" until the STMA troughs: Often a good time to "Buy".
- Old BearFrom the trough of the STMA usually until the next crossover from "Bear" to "Bull".
- BuyOur individual "buy" prompts are shown by vertical red lines.
Evaluation Report
A more detailed portfolio analysis is available to interested parties on application (see below). It includes:
- Performance tables
- Graphs combining Buys, Sells, Bull/Bear Phase and Trade History
Contact Us
info@warnboro.com.
Risk Warnings
This publication is intended to be our commentary on markets and on our own investment strategy. There is no fund or collective investment vehicle which gives external investors access to our investment strategy which is currently employed exclusively to manage internal portfolios and Warnborough is not a regulated business. Our positions reflect the latest version of our software and our actual (historic) trades may not be the same as the illustrative trades shown in this publication. Our software is continuously evolving and our actual track record "lags" our latest software. You should not treat this publication as a recommendation to buy, sell or trade in any of the investments, juristictions or asset classes mentioned. The value of our investments may rise as well as fall.
