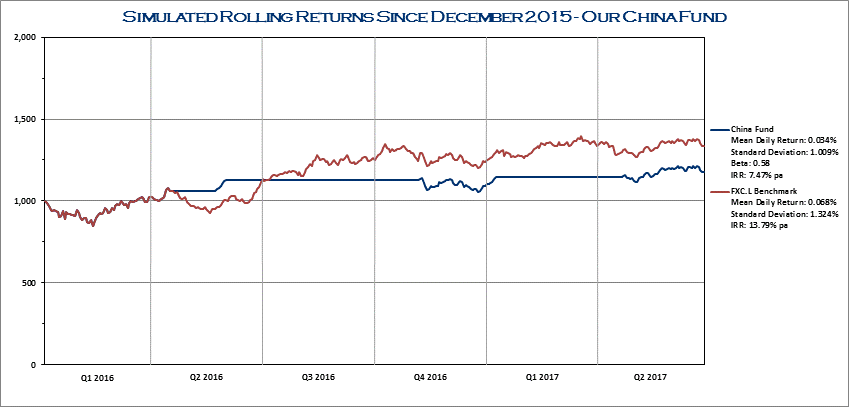
Our China Fund uses an internal model to manage a benchmark ETF (In this case FXC.L, an ETF which tracks the FTSE China 50 Index), switching into and out of cash.
The results in the table are simulations based on our latest back tests.
The graph shows the return on an investment of £1,000 compared to the benchmark.
| China Fund | Q1 | Q2 | Q3 | Q4 | YEAR | BENCHMARK | ALPHA |
|---|---|---|---|---|---|---|---|
| 2014 | -6.28% | 6.27% | 11.08% | 0.00% | 10.63% | 17.48% | -6.85% |
| 2015 | 8.23% | 0.00% | -12.38% | 10.38% | 4.68% | -11.86% | 16.54% |
| 2016 | -1.21% | 10.29% | 0.00% | -3.32% | 5.34% | 19.74% | -14.40% |
| 2017 | 5.06% | 2.77% | TBA | TBA | 7.97% | 8.03% | -0.06% |

