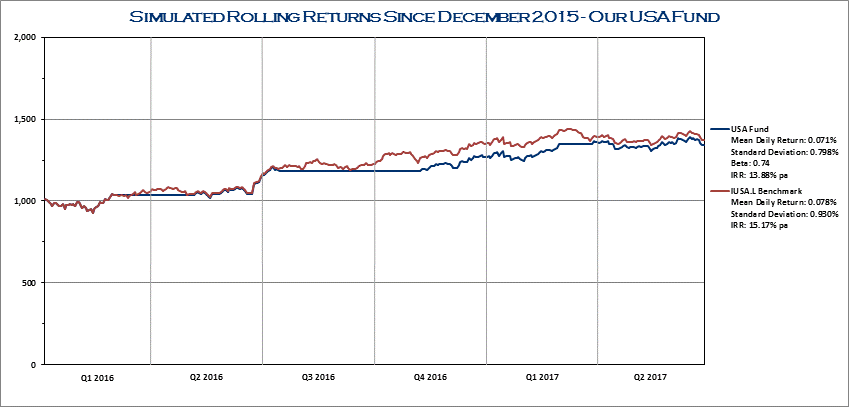
Our USA Fund uses an internal model to manage a benchmark ETF (In this case IUSA.L, an ETF which tracks the S+P 500), switching into and out of cash.
The results in the table are simulations based on our latest back tests.
The graph shows the return on an investment of £1,000 compared to the benchmark.
| USA Fund | Q1 | Q2 | Q3 | Q4 | YEAR | BENCHMARK | ALPHA |
|---|---|---|---|---|---|---|---|
| 2014 | 0.66% | 2.42% | 6.61% | 3.67% | 13.94% | 19.95% | -6.01% |
| 2015 | 0.00% | -1.50% | -3.97% | 9.87% | 3.93% | 3.87% | 0.06% |
| 2016 | 1.23% | 10.69% | 3.01% | 7.18% | 23.71% | 31.71% | -8.00% |
| 2017 | 7.20% | -1.30% | TBA | TBA | 5.80% | 1.94% | 3.86% |

